Demo#
Author: Cindy Chiao
What is xbatcher?#
Xbatcher is a small library for iterating through Xarray objects (DataArrays and Datasets) in batches. The goal is to make it easy to feed Xarray objects to machine learning libraries such as Keras and PyTorch.
What is included in this notebook?#
showcase current abilities with example data
brief discussion of current development track and ideas for future work
[1]:
import xarray as xr

import xbatcher
Example data#
Here we will load an example dataset from a global climate model. The data is from the historical experiment from CMIP6 and represents 60 days of daily max air temperature.
[2]:
store = 's3://carbonplan-share/xbatcher/example_cmip6_data.zarr'
ds = xr.open_dataset(
    store, engine='zarr', chunks={}, backend_kwargs={'storage_options': {'anon': True}}
)

# inspect the dataset
ds
[2]:
<xarray.Dataset> Size: 7MB
Dimensions:  (lat: 145, lon: 192, time: 60)
Coordinates:
  * lat      (lat) float64 1kB -90.0 -88.75 -87.5 -86.25 ... 87.5 88.75 90.0
  * lon      (lon) float64 2kB 0.0 1.875 3.75 5.625 ... 352.5 354.4 356.2 358.1
  * time     (time) datetime64[ns] 480B 1850-01-01T12:00:00 ... 1850-03-01T12...
Data variables:
tasmax (time, lat, lon) float32 7MB dask.array<chunksize=(60, 145, 192), meta=np.ndarray>[3]:
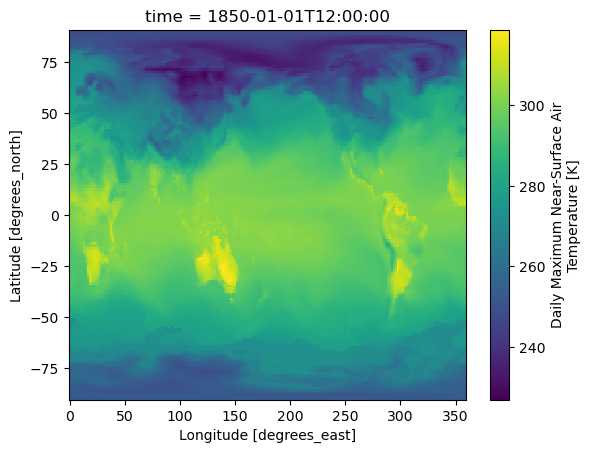
# plot the first time dimension
ds.isel(time=0).tasmax.plot();
Matplotlib is building the font cache; this may take a moment.
Batch generation#
Xbatcher’s BatchGenerator can be used to generate batches with several arguments controlling the exact behavior.
The input_dims argument takes a dictionary specifying the size of the inputs in each dimension. For example, {'time': 10} means that each of the input sample will have 10 time points, while all other dimensions are flattened to a “sample” dimension
Note that even though ds in this case only has one variable, the function can operate on multiple variables at the same time.
[4]:
n_timepoint_in_each_sample = 10

bgen = xbatcher.BatchGenerator(
    ds=ds,
    input_dims={'time': n_timepoint_in_each_sample},
)

print(f'{len(bgen)} batches')
6 batches
[5]:
batch = bgen[0]
batch
[5]:
<xarray.Dataset> Size: 2MB
Dimensions:  (time: 10, sample: 27840)
Coordinates:
  * time     (time) datetime64[ns] 80B 1850-01-01T12:00:00 ... 1850-01-10T12:...
  * sample   (sample) object 223kB MultiIndex
  * lat      (sample) float64 223kB -90.0 -90.0 -90.0 -90.0 ... 90.0 90.0 90.0
  * lon      (sample) float64 223kB 0.0 1.875 3.75 5.625 ... 354.4 356.2 358.1
Data variables:
tasmax (sample, time) float32 1MB 252.6 250.9 250.4 ... 240.6 234.6 233.4We can verify that the outputs have the expected shapes.
For example, there are 60 time points in our input dataset, we’re asking 10 timepoints in each batch, thus expecting 6 batches
[6]:
expected_n_batch = len(ds.time) / n_timepoint_in_each_sample
print(f'Expecting {expected_n_batch} batches, getting {len(bgen)} batches')
Expecting 6.0 batches, getting 6 batches
There are 145 lat points and 192 lon points, thus we’re expecting 145 * 192 = 27840 samples in a batch.
[7]:
expected_batch_size = len(ds.lat) * len(ds.lon)
print(
    f'Expecting {expected_batch_size} samples per batch, getting {len(batch.sample)} samples per batch'
)
Expecting 27840 samples per batch, getting 27840 samples per batch
Controlling the size/shape of batches#
We can use batch_dims and concat_input_dims options to control how many sample ends up in each batch. For example, we can specify 10 time points for each sample, but 20 time points in each batch this should yield half as many batches and twice as many samples in a batch as the example above note the difference in dimension name in this case
[8]:
n_timepoint_in_each_sample = 10
n_timepoint_in_each_batch = 20

bgen = xbatcher.BatchGenerator(
    ds=ds,
    input_dims={'time': n_timepoint_in_each_sample},
    batch_dims={'time': n_timepoint_in_each_batch},
    concat_input_dims=True,
)

print(f'{len(bgen)} batches')
3 batches
[9]:
bgen[0]
[9]:
<xarray.Dataset> Size: 8MB
Dimensions:      (time_input: 10, sample: 55680)
Coordinates:
    time         (sample, time_input) datetime64[ns] 4MB 1850-01-01T12:00:00 ...
  * sample       (sample) object 445kB MultiIndex
  * input_batch  (sample) int64 445kB 0 0 0 0 0 0 0 0 0 0 ... 1 1 1 1 1 1 1 1 1
  * lat          (sample) float64 445kB -90.0 -90.0 -90.0 ... 90.0 90.0 90.0
  * lon          (sample) float64 445kB 0.0 1.875 3.75 ... 354.4 356.2 358.1
Dimensions without coordinates: time_input
Data variables:
tasmax (sample, time_input) float32 2MB dask.array<chunksize=(27840, 10), meta=np.ndarray>Last batch behavior#
If the input ds is not divisible by the specified input_dims, the remainder will be discarded instead of having a fractional batch. See xarray-contrib/xbatcher#82 for more on this topic.
[10]:
n_timepoint_in_batch = 31

bgen = xbatcher.BatchGenerator(ds=ds, input_dims={'time': n_timepoint_in_batch})

for batch in bgen:
    print(f'last time point in ds    is {ds.time[-1].values}')
    print(f'last time point in batch is {batch.time[-1].values}')
batch
last time point in ds    is 1850-03-01T12:00:00.000000000
last time point in batch is 1850-01-31T12:00:00.000000000
[10]:
<xarray.Dataset> Size: 4MB
Dimensions:  (time: 31, sample: 27840)
Coordinates:
  * time     (time) datetime64[ns] 248B 1850-01-01T12:00:00 ... 1850-01-31T12...
  * sample   (sample) object 223kB MultiIndex
  * lat      (sample) float64 223kB -90.0 -90.0 -90.0 -90.0 ... 90.0 90.0 90.0
  * lon      (sample) float64 223kB 0.0 1.875 3.75 5.625 ... 354.4 356.2 358.1
Data variables:
tasmax (sample, time) float32 3MB 252.6 250.9 250.4 ... 257.6 256.9 243.3Overlapping inputs#
In the example above, all samples have distinct time points. That is, for any lat/lon pixel, sample 1 has time points 1-10, sample 2 has time point 11-20, and they do not overlap however, in many machine learning applications, we will want overlapping samples (e.g. sample 1 has time points 1-10, sample 2 has time points 2-11, and so on). We can use the input_overlap argument to get this behavior.
[11]:
n_timepoint_in_each_sample = 10
n_timepoint_in_each_batch = 20
input_overlap = 9

bgen = xbatcher.BatchGenerator(
    ds=ds,
    input_dims={'time': n_timepoint_in_each_sample},
    batch_dims={'time': n_timepoint_in_each_batch},
    concat_input_dims=True,
    input_overlap={'time': input_overlap},
)

batch = bgen[0]

print(f'{len(bgen)} batches')
batch
3 batches
[11]:
<xarray.Dataset> Size: 85MB
Dimensions:      (time_input: 10, sample: 556800)
Coordinates:
    time         (sample, time_input) datetime64[ns] 45MB 1850-01-01T12:00:00...
  * sample       (sample) object 4MB MultiIndex
  * input_batch  (sample) int64 4MB 0 0 0 0 0 0 0 0 ... 19 19 19 19 19 19 19 19
  * lat          (sample) float64 4MB -90.0 -90.0 -90.0 -90.0 ... 90.0 90.0 90.0
  * lon          (sample) float64 4MB 0.0 1.875 3.75 5.625 ... 354.4 356.2 358.1
Dimensions without coordinates: time_input
Data variables:
tasmax (sample, time_input) float32 22MB dask.array<chunksize=(27840, 10), meta=np.ndarray>We can inspect the samples in a batch for a lat/lon pixel, noting that the overlap applies across batches.
[12]:
lat = -90
lon = 0
pixel = batch.sel(lat=lat, lon=lon)
display(pixel)

print(
    f'sample 1 goes from {pixel.isel(input_batch=0).time[0].values} to {pixel.isel(input_batch=0).time[-1].values}'
)
print(
    f'sample 2 goes from {pixel.isel(input_batch=1).time[0].values} to {pixel.isel(input_batch=1).time[-1].values}'
)
<xarray.Dataset> Size: 3kB
Dimensions:      (input_batch: 20, time_input: 10)
Coordinates:
    time         (input_batch, time_input) datetime64[ns] 2kB 1850-01-01T12:0...
  * input_batch  (input_batch) int64 160B 0 1 2 3 4 5 6 ... 13 14 15 16 17 18 19
    lat          float64 8B -90.0
    lon          float64 8B 0.0
Dimensions without coordinates: time_input
Data variables:
    tasmax       (input_batch, time_input) float32 800B dask.array<chunksize=(20, 10), meta=np.ndarray>
sample 1 goes from 1850-01-01T12:00:00.000000000 to 1850-01-10T12:00:00.000000000
sample 2 goes from 1850-01-02T12:00:00.000000000 to 1850-01-11T12:00:00.000000000
Example applications#
These batches can then be used to train a downstream machine learning model while preserving the indices of these sample.
As an example, let’s say we want to train a simple CNN model to predict the max air temprature for each day at each lat/lon pixel. To predict the temperature at lat/lon/time of (i, j, t), we’ll use features including the temperature of a 9 x 9 grid centered at (i, j), from times t-10 to t-1 (shape of input should be (n_samples_in_each_batch, 9, 9, 9)). Note that in this example, we subset the dataset to a smaller domain for efficiency.
[13]:
bgen = xbatcher.BatchGenerator(
    ds=ds[['tasmax']].isel(lat=slice(0, 18), lon=slice(0, 18), time=slice(0, 30)),
    input_dims={'lat': 9, 'lon': 9, 'time': 10},
    batch_dims={'lat': 18, 'lon': 18, 'time': 15},
    concat_input_dims=True,
    input_overlap={'lat': 8, 'lon': 8, 'time': 9},
)

for i, batch in enumerate(bgen):
    print(f'batch {i}')
    # make sure the ordering of dimension is consistent
    batch = batch.transpose('input_batch', 'lat_input', 'lon_input', 'time_input')

    # only use the first 9 time points as features, since the last time point is the label to be predicted
    features = batch.tasmax.isel(time_input=slice(0, 9))
    # select the center pixel at the last time point to be the label to be predicted
    # the actual lat/lon/time for each of the sample can be accessed in labels.coords
    labels = batch.tasmax.isel(lat_input=5, lon_input=5, time_input=9)

    print('feature shape', features.shape)
    print('label shape', labels.shape)
    print('shape of lat of each sample', labels.coords['lat'].shape)
    print('')
batch 0
feature shape (1500, 9, 9, 9)
label shape (1500,)
shape of lat of each sample (1500,)

batch 1
feature shape (600, 9, 9, 9)
label shape (600,)
shape of lat of each sample (600,)
We can also use the Xarray’s “stack” method to transform these into 2D inputs (n_samples, n_features) suitable for other machine learning algorithms implemented in libraries such as sklearn and xgboost. In this case, we are expecting 9 x 9 x 9 = 729 features total.
[14]:
for i, batch in enumerate(bgen):
    print(f'batch {i}')
    # make sure the ordering of dimension is consistent
    batch = batch.transpose('input_batch', 'lat_input', 'lon_input', 'time_input')

    # only use the first 9 time points as features, since the last time point is the label to be predicted
    features = batch.tasmax.isel(time_input=slice(0, 9))
    features = features.stack(features=['lat_input', 'lon_input', 'time_input'])

    # select the center pixel at the last time point to be the label to be predicted
    # the actual lat/lon/time for each of the sample can be accessed in labels.coords
    labels = batch.tasmax.isel(lat_input=5, lon_input=5, time_input=9)

    print('feature shape', features.shape)
    print('label shape', labels.shape)
    print('shape of lat of each sample', labels.coords['lat'].shape, '\n')
batch 0
feature shape (1500, 729)
label shape (1500,)
shape of lat of each sample (1500,)

batch 1
feature shape (600, 729)
label shape (600,)
shape of lat of each sample (600,)
What’s next?#
There are many additional useful features that were yet to be implemented in the context of batch generation for downstream machine learning model training purposes. One of the current efforts is to improve the set of data loaders.
Additional features of interest can include:
Shuffling/randomization of samples across batches. It is often desirable for each batch to be grouped randomly instead of along a specific dimension.
Be efficient in terms of memory usage. In the case where overlap is enabled, each sample would comprised of mostly repetitive values compared to adjacent samples. It would be beneficial if each batch/sample is generated lazily to avoid storing these extra duplicative values.
Handling preprocessing steps. For example, data augmentation, scaling/normalization, outlier detection, etc.
More thoughts on 1. can be found in this discussion. Interested users are welcomed to comment or submit other issues in GitHub.